Fall 2020 Inside IR
Inside This Issue
Changes in Enrollment Since Last Fall
By Elina Belyablya
Programs with increased enrollment:
- Psychology (+48.5%)
- Optical Systems Technology AAS(+57.4%)
- Science programs (+10.3%)
- Health programs (+1.5%).
Programs with decreased enrollment:
- LA&S: General Studies(-21.9%)
- VAPA (-19.6%)
- Downtown programs(-15.0%)
- Technical Education(-10.2%)
- Business (-3.7%)
The enrollment decline this fall as compared to last fall is primarily due to a decrease in the number of full-time students (-1,411 students), which includes students’ potential shift to part-time status. This could be due to multiple variables from academics to external pressures.
A decrease in the number of first-time students (-473 students, -18.7%) may steepen a decline in future semesters. But a relatively stable amount of students transferring in to MCC (-1.1%), along with the expected number of spring 2020 students who continued here this semester, could serve as anchors for future enrollment planning.
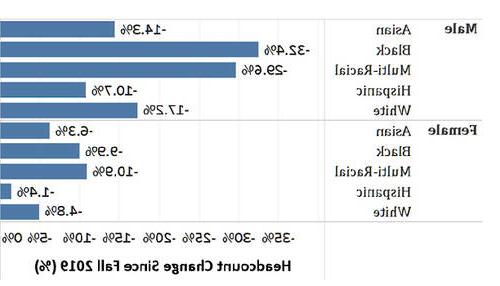
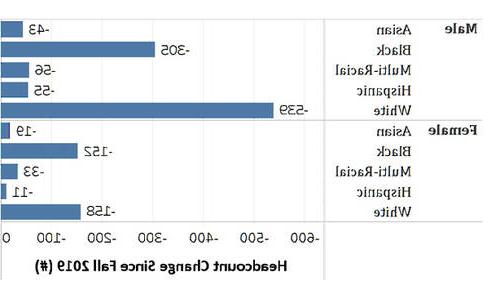
The decrease in the number of male students is three times larger than that of females. There are 539 fewer White males and 305 fewer Black males enrolled compared to last fall. Hispanic and Asian students remain relatively stable. This is illustrated in Figure 1.
Other changes since last fall are as follows:
- About 94.5% of active course sections are designated as Remote, Online, or Hybrid, raising the need for academic supports but bringing opportunities for more options in course modality. Remote sections have time and technology access constraints. But they preclude the typical complications inherent in transportation and physical location matters.
- There was a 4.4 percentage point (+93 students) increase in out-of-county students. But the percentage of in-county students decreased (-15.9%, -1,504students).
- There is a steeper decline in the enrollment of students under age 25 (-1,153 students) than those age 25+.
Figure 1 For Changes in Enrollment Since Last Fall
Figure 1: Enrollment Changes since Last Fall by Sex and Race/Ethnicity
COVID-19 Impact on Course Success Rates
By William Dixon
Online courses have always had a lower C-or-better rate than face-to-face, but spring 2020 had little impact on this rate.
During the spring 2020 term, courses were forced to go from face-to-face to a remote platform. This change in delivery mode also changed the success of students in the courses. The two spring semesters leading up to spring 2020 both averaged above 69% in terms of the C-or-better rate. Spring 2020 had a C-or-better rate of 65.5%, 4 percentage points lower than the previous two terms. (See Table 1.)
Online courses have always had a lower C-or-better rate than face-to-face, but spring 2020 had little impact on this rate.
In terms of student populations, the C-or-Better rate for males declined 6percentage points, three times higher than the rate for female students.
Success rates for Pell and non-Pell eligible students both showed de-clines, which indicates that the drop in course success is not explained by students’ socioeconomic status.
Online courses have always had a lower C-or-better rate than face-to-face, but spring 2020 had little impact on this rate.
Developmental math coursework (MTH 096, 098, and 099) did not show a decline in the number of C-or-Better grades awarded but an increase in the rate.
Somewhat surprisingly, developmental math coursework (MTH 096, 098, and 099) did not show a decline in the number of C-or-Better grades awarded but an increase in the rate. This may be explained by the design of the course, but warrants further investigation going forward. (See Figure 2.)
Figure 2 for COVID-19 Impact on Course Success Rates
Figure 2. C-or-Better Rates in Spring 2020 Courses
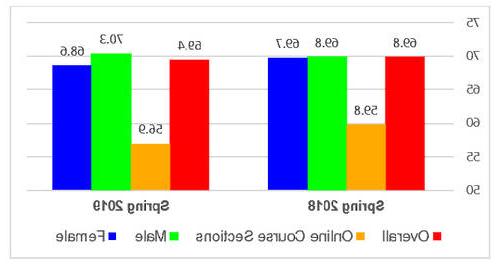
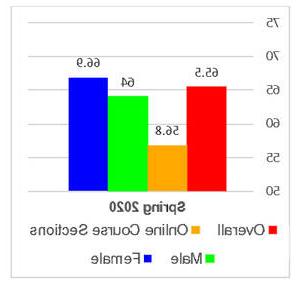
Table 1 For COVID-19 Impact on Course Success Rates
| Student Category | Spring 2018 | Spring 2019 | Spring 2020 |
|---|---|---|---|
| Pell Eligible | 78.5% | 78.7% | 73.8% |
| Non Pell Eligible | 62.0% | 61.2% | 58.8% |
| Developmental Math Coursework (096, 098, 099) | 37.0% | 30.1% | 43.0% |
| TRS Coursework | 56.6% | 52.4% | 47.4% |
Focus On: Downtown Enrollment
By Elina Belyablya
Enrollment in the Paralegal program has grown 25.7%.
Enrollment in Downtown programs (Criminal Justice, Human Services, Education) decreased 15.0% from last fall, while the number of students with at least one Downtown course decreased 2.4%. However, enrollment among students with any Downtown course (excluding students in Downtown programs) increased 10.8%. (See Table 2.) The increases came from White (+186) and Asian (+34) students.
This semester, with the exception of two hybrid CRJ sections, only remote courses are offered Downtown. As a result, many more students are taking a mixture of Downtown and Brighton courses compared to those who previously took exclusively Downtown course loads. (See Figure 3.)
Figure 3 For Focus on Downtown Enrollment
Figure 3: Fall 2020 Course Enrollment by Campus

Table 2 for Focus On: Downtown Enrollment
| Program Group | Fall 2019 | Fall 2020 | # Change | % Change |
|---|---|---|---|---|
| Business | 52 | 62 | 10 | 19.2% |
| Health | 127 | 188 | 61 | 48.0% |
| LA General Studies | 580 | 538 | -42 | -7.2% |
| LA-VAPA | 26 | 24 | -2 | -7.7% |
| Non-degree Seeking | 73 | 76 | 3 | 4.1% |
| Public Safety | 8 | 18 | 10 | 125.0% |
| Science (inc. LA-Science) | 51 | 90 | 39 | 76.5% |
| Career & Technical Ed | 44 | 69 | 25 | 56.8% |
| Grand Total | 961 | 1,065 | 104 | 10.8% |
What Happened to the Class of 2019?
By Mary Ann M. DeMario
The “What Happened to the Class of 2019?” report has been posted on the IR website. The links were emailed to faculty and staff as well as our off-campus constituents (e.g., local college presidents, high school counselors). No hard copies were printed this year.
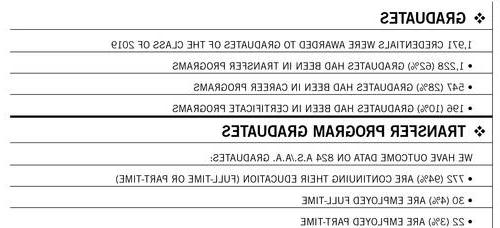
During the 2018-19 academic year, MCC awarded 1,775 associate degrees and 196 certificates. Outcome data was collected on 62% of graduates.
Some of the report highlights include:
- 61% of graduates are employed and/or continuing their education.
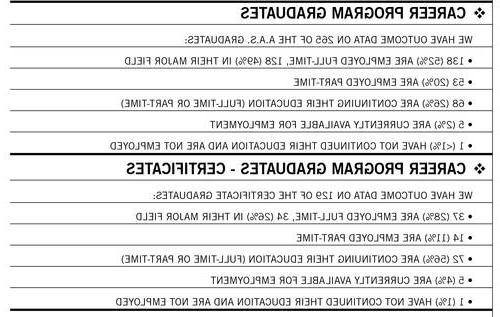
- Local employers continue to hire the majority of our graduates who enter the workforce. Of the career and certificate graduates who secured full-time employment, 93% are employed in Monroe or an adjacent county.
- 63% of the graduates who transferred are attending SUNY or CUNY institutions.
Graduates’ outcomes by award type are shown in Figure 4.
Figure 4 For What Happened to the Class of 2019?
Figure 4: Graduates’ Outcomes by Program Type
Additional Information & Contacts
For more information, you can visit the Institutional Research (IR) website or contact an IR staff member:
- William Dixon, Director, (585) 292-3031
- Elina Belyablya, Assistant Director, (585) 292-3033
- Mary Ann Matta DeMario, Specialist, (585) 292-3032
- Allison Wanek, Clerk, (585) 292-3035
Previous issues of Inside IR are available through our Newsletters webpage.

